Mystic River Watershed, MA
Urban Heat and Air Quality
in Mystic River Watershed
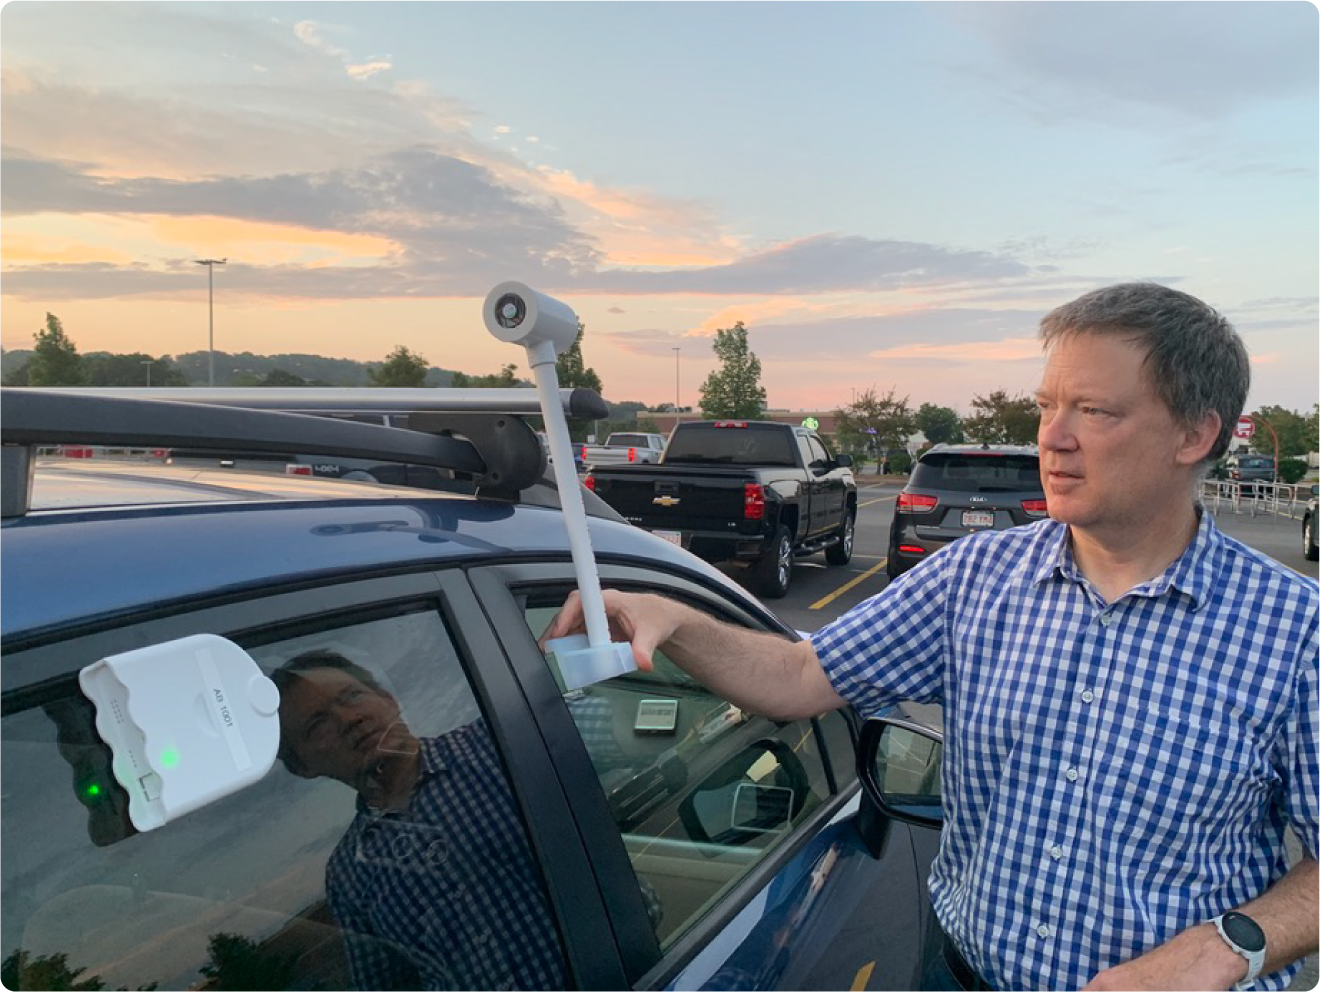
On August 12 and 13, 2021, 80 volunteers set out to collect air temperature and air quality data of the Mystic River Watershed during an extreme heat day. One driver and one navigator made up each volunteer science team, driving together to collect data over an hour-long mapping period at specific times of day. These data were then used to create these maps of the hottest neighborhoods and those with the worst air quality.
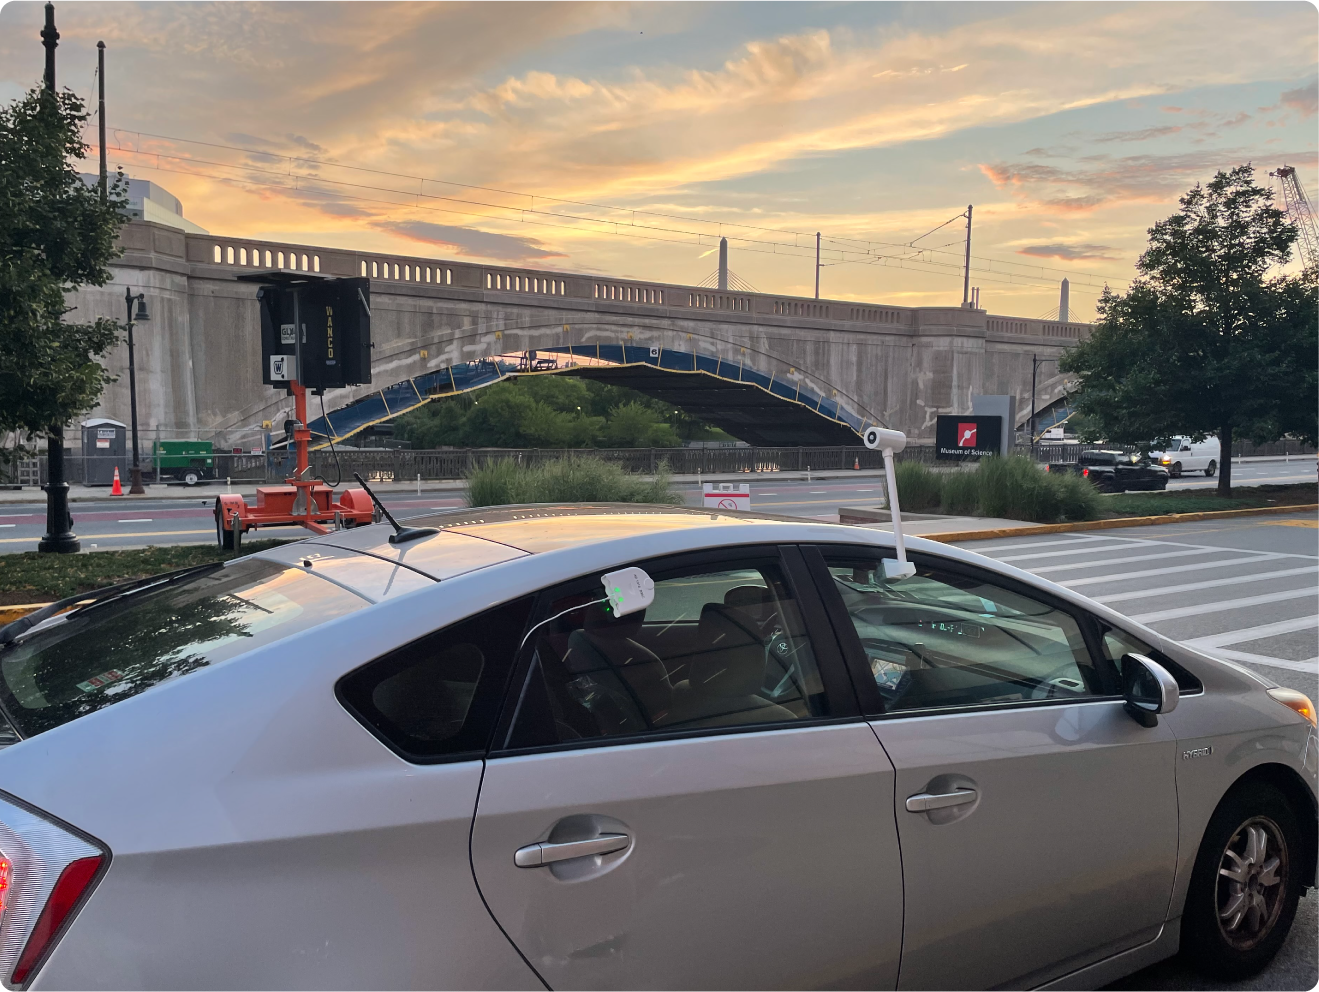
In order to capture real time air temperature and air quality data, volunteers mounted two types of sensors on their vehicle windows. A CAPA temperature sensor, which records the ambient air temperature once per second, and an AirBeam air quality sensor, which measures the amount of particulate matter of a certain size (PM2.5) as the car drives along the predetermined route.
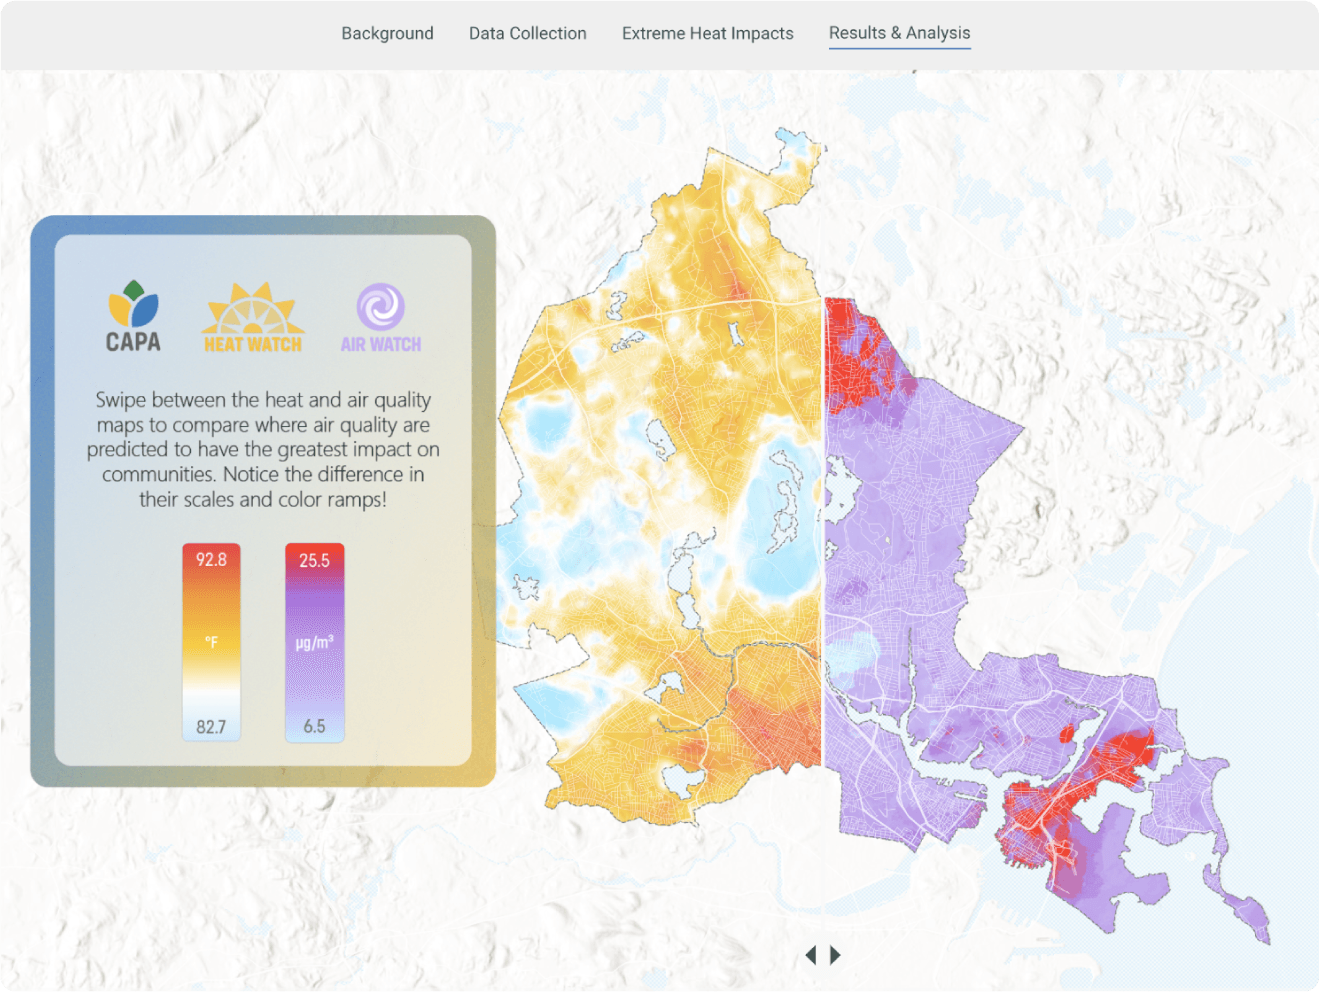
One of the main goals of the Wicked Hot Mystic campaign was to increase awareness and community engagement with the problem of extreme heat in the Boston area. Conducting Wicked Hot Mystic as a volunteer science effort was not only essential in helping us record data across the whole watershed over the course of 24 hours, but it also empowered community members to learn about and contribute to climate resilience efforts in their communities. CAPA built a customized StoryMap (seen above) to facilitate these goals for the Mystic River Watershed Association and Museum of Science Boston.